Calculating county-level estimates of eligible voting populations by age, English language ability, and ethnicity
This past fall, I put my data analysis skills to work to work for a political campaign for the first time. The organization I was helping with was called Asian Americans Against Trump, a project of the New American Voices PAC. The mission of the group is to reach out specifically to voting-eligible Asian Americans with language and culturally-specific information to persuade them to vote against the re-election of President Donald Trump.
Asian Americans are the fastest growing voting bloc in the United States, but voter turnout historically has been quite low. In addition, political campaigns seldom focus effort on Asian American communities because the diversity (language, history, culture) within the group makes it difficult to deploy strategies at scale. AAAT’s mission has been to deploy language and culturally-specific political advertisements to these groups, specifically in areas of the country where the Asian American vote was likely to make the biggest difference (for example, swing states that have sizable voter-eligible Asian populations). My small contribution to the group was to help them figure out which counties to focus ads and additional research on.
To do this, I first collected data from several public sources:
-
ACS county-level estimates of numbers of people identifying as specific Asian ethnicities (e.g.: Chinese, Filipino, Vietnamese, Korean, Japanese, Pakistani, Hmong, etc). This is the 5-year estimate (2018) TableID = B02015.
-
IPUMS microdata, extracted using their online data query tool. IPUMS is curated microdata (anonymized individual-level data that are collected for Census Bureau products). This means, that each “row” in this tabular data set represents one person. The highest resolution locational data associated with each observation is the county, however, keep in mind that because this is a sample, the finer you go with the geography, the more likely it is that you will underrepresent co-occuring demographics.
The reason that I needed both these datasets is that the census population totals by ethnicity only give overall estimates of numbers for each ethnicity in each county. Looking at that data, I would not know how many of those were actually eligible to vote, or had limited language proficiency. With the IPUMS microdata, I could isolate individuals that had combinations of characteristics, count them, and get an estimate of their proportion within their ethnicity’s total population in the IPUMS sample. In order to balance the number of demographic variable combinations I could find with geographic specificity, I calculated these proportions at the state-level for each ethnicity.
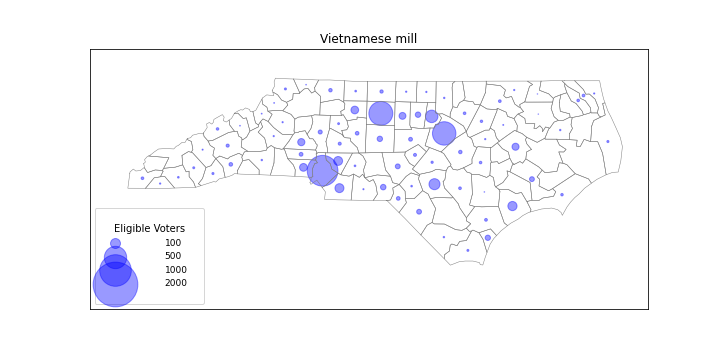
I could then use that proportion and multiply it against the county-level census data to get estimates of numbers of very specific groups, essentially “downscaling” the state-level proportions to county-level estimates. In North Carolina for example, I could get estimates of voter-eligible Vietnamese millennials:

Having estimates of these different subpopulation totals (e.g.: Limited English Proficiency x voter-eligible x Chinese ethnicity) is useful, but to decide where to focus additional research or where you will get the “biggest bang for your buck” we needed to layer on an additional piece of information: voter power.
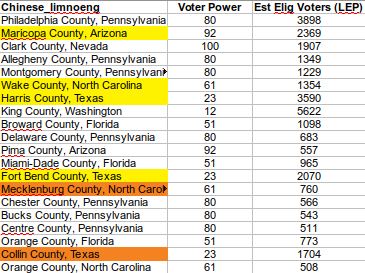
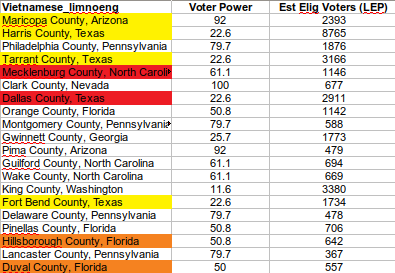
The idea of voter power reflects the reality that some votes have an outsized effect on deciding the results of elections. For the presidential election, you can think of states with high voter power as “swing states” x ability for that state to change the outcome of the election. Applying Princeton University professor Sam Wang’s estimates of voter power by state for the 2020 presidential election to the Asian subpopulation estimates above, I could tell you in which counties you could focus research/outreach to specific subpopulations, based on the actual ability of those votes to change the outcome of the election. Sam Wang talks about this as election “Moneyball”, after the Oakland A’s practice of using statistical analysis to obtain the highest marginal value players given limited resources. In addition to high Asian voter power counties for the presidential election, I also calculated high voter power counties for Senate, and state legislature races where redistricting policies were being decided. I came up with lists of top 20 counties to focus on for each ethnicities’ Limted English Proficiency advertisements. See below for the tables for Chinese LEP and Vietnamese LEP for the presidential election, ranked by most important counties. Notice that the ranking based on voter power x number of voters does not always been that the counties that have the highest number of voters is “more important”. King County Washington has 5,622 LEP Chinese voters, but because Washington is unlike to swing the outcome of the election, it does not rank as high for targeting the estimated 3,898 Chinese LEPs in Philadelphia County, Pennsylvania, which is an important swing state. The colored highlighting in these tables indicate the the county is important in more than just the presidential race. Yellow indicates that it is important in the presidential and senate races; orange that it is important in presidential and redistricting races, and red that it is important in all three. Vietnamese in Charlotte? GO VOTE! Your vote is critical to the election!!

